Track North Star Metric with Qfloo


Gokul Rangarajan
4 postsPitchworks VC Studio , Investing and building on Healthcare and Productivity

At Pitchworks VC Studio, we act as co-founders of the startups we partner with, working closely with the founding teams to build and scale their businesses. As one of the General Partners, my role is to track the performance of our portfolio companies on a daily, if not weekly basis. Since we are actively involved in the day-to-day operations, it’s crucial to have a structured and transparent system to monitor progress across all departments. This includes tracking both key success metrics (such as revenue growth, customer acquisition cost, and retention) and North Star metrics (the one defining metric that drives sustainable growth). Keeping track of these metrics in real-time helps us identify early signs of progress or potential challenges, enabling us to make informed decisions quickly.
This is where Qfloo has been instrumental. By building customized dashboards tailored to the needs of each portfolio company, Qfloo allows us to centralize all critical data points in one place. We can monitor key performance indicators (KPIs) across sales, marketing, product development, and customer success, ensuring that every department is aligned with the broader company objectives. The ability to access and analyze real-time data helps us adjust strategies on the fly, allocate resources more effectively, and support our co-founders with data-driven insights. Qfloo has phenomenally enhanced our day-to-day operations by providing clarity and control over business performance, ultimately accelerating the path to product-market fit and long-term success.
At Pitchworks VC Studio, we follow a structured three-step approach for tracking key metrics across both our portfolio companies and Pitchworks’ internal operations through a master dashboard built on Qfloo:
1 Set Goals – We define clear, measurable goals for each department, aligning them with the startup’s North Star metric. This ensures that every action taken contributes directly to the broader company objective and long-term growth. For Pitchworks, we set internal goals focused on fund performance, portfolio success rates, and market expansion.
2 Assign Tasks – Once goals are set, we break them down into actionable tasks. Each task is assigned to a specific team or individual with defined timelines and accountability. This applies to both the portfolio companies and Pitchworks’ internal operations, ensuring alignment across the board.
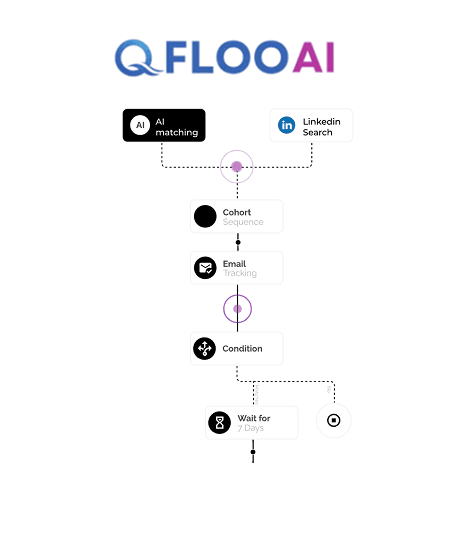
3Track Progress – We use Qfloo to monitor real-time progress through a master dashboard that consolidates data from all portfolio companies and Pitchworks’ internal activities. The dashboard helps us identify gaps early, adjust strategies, and ensure that both our startups and Pitchworks itself stay on track.
The master dashboard provides a centralized view of performance across the entire ecosystem, enabling us to track growth, engagement, and operational efficiency metrics simultaneously for each startup and for Pitchworks. This real-time visibility helps us drive faster, more informed decision-making and maintain strategic alignment across all stakeholders.
Core Metrics We Track at Pitchworks VC Studio
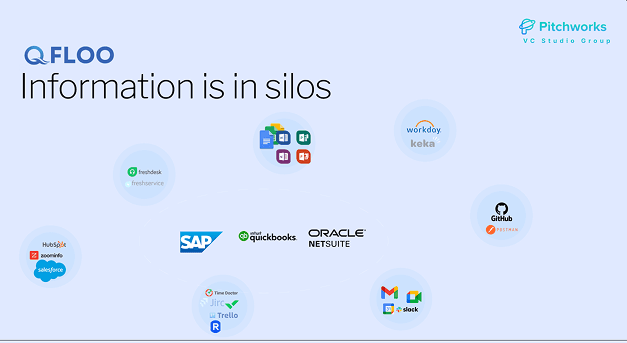
We track key metrics across spending, development, and other operational areas using a combination of Google Sheets, Zoho Books, bank statements, Kwpaio, and GitHub. This allows us to have a clear picture of both financial and operational health at all times.
1. Spending Metrics (Tracked in Google Sheets, Zoho Books, and Bank Statements)

We monitor monthly and year-to-date (YTD) spending to ensure alignment with the budget and financial targets:
- Current Month Projected Spend – Planned spend for the current month.
- Current Month Actual Spend – Actual spend recorded for the current month.
- Projected Monthly Spend So Far (YTD) – Cumulative projected spend for the year up to the current month.
- Actual YTD Spend So Far (YTD) – Actual cumulative spend for the year up to the current month.
- Projected Spend vs. Actual Spend – Variance between projected and actual spend.
- Excess/Short Monthly Spend (as of last month) – Difference between projected and actual spend for the previous month.
2. Development Metrics (Tracked in Kwapio and GitHub)

Development is primarily the responsibility of the technical partner or co-founder. We track progress through sprint planning, delivery, and quality assurance:
- Planned Demos – Number of demos planned for the current sprint or cycle.
- Delivered Demos – Number of demos actually delivered.
- Sprint Planned vs. Delivered – Comparison of the planned and completed sprints.
- Development Roadmap (Next 5 Sprints) – Status of the planned roadmap for the next five sprints.
- % of QA Completion – Percentage of features or releases that have passed quality assurance.
- Number of Production Bugs – Total number of bugs reported in production.
- Sales-Driven Items Pending – Number of development tasks pending based on sales team feedback.
3. Outreach and Meetings Metrics

Another key area we track at Pitchworks VC Studio is outreach and meeting performance. Outreach and meetings are critical for building a strong sales pipeline, generating leads, and driving customer engagement. We monitor outreach efforts on a daily, monthly, and year-to-date (YTD) basis to ensure consistency and alignment with overall business goals.
Outreach Metrics (Tracked in Klustack, Apollo.io, and LinkedIn)
Our SDR (Sales Development Representatives) team at Pitchworks follows a structured outreach plan using Klustack, Apollo.io, and LinkedIn to maximize engagement and lead generation. We track the following outreach metrics:
- MTD Projected No. of Emails/LinkedIn Messages – The number of outreach attempts (emails and LinkedIn messages) planned for the current month.
- MTD Actual No. of Emails/LinkedIn Messages – The actual number of outreach attempts made in the current month.
- YTD Projected No. of Emails/LinkedIn Messages – The cumulative number of outreach attempts planned for the year so far.
- YTD Actual No. of Emails/LinkedIn Messages – The actual cumulative number of outreach attempts made for the year.
- Projected vs. Actuals – The variance between the planned and actual outreach numbers.
- Excess/Short – The surplus or shortfall in outreach numbers compared to the target.
This helps us measure the effectiveness of outreach efforts, identify gaps, and adjust strategies in real time to improve conversion rates.
Meetings Metrics (Tracked in Apollo.io)
Meetings are a direct outcome of successful outreach. We track meeting performance to evaluate how well outreach efforts are translating into meaningful sales conversations and demos. Metrics tracked include:
- MTD Projected No. of Meetings – The number of meetings planned for the current month.
- MTD Actual No. of Meetings – The actual number of meetings conducted in the current month.
- YTD Projected No. of Meetings – The cumulative number of meetings planned for the year so far.
- YTD Actual No. of Meetings – The actual cumulative number of meetings conducted for the year.
- Projected vs. Actuals – The variance between the planned and actual meeting numbers.
- Excess/Short – The surplus or shortfall in meeting numbers compared to the target.
Our SDR team at Pitchworks works with weekly outreach and meeting targets, ensuring that outreach efforts are consistently followed up with scheduled meetings and demos. Apollo.io helps us automate the meeting scheduling process, and demos are directly tracked from these meetings. This creates a seamless flow from outreach to conversion, helping us identify where improvements are needed in the outreach-to-demo pipeline.
By combining outreach and meeting metrics with development and financial tracking, we maintain a clear and comprehensive view of the sales pipeline and overall business health.
4. Founder Profile and Content Metrics

To strengthen outreach on LinkedIn and email, we believe in building a strong LinkedIn profile, brand identity, and content strategy. This includes creating high-quality blog content and refining the brand’s voice to ensure consistency and engagement. A strong LinkedIn presence and valuable content will enhance credibility, increase visibility, and drive meaningful connections with the target audience.
To execute this, we will set clear targets and assign a dedicated content manager responsible for creating and managing content across platforms. This includes developing regular blog posts, LinkedIn updates, and email campaigns aligned with the brand’s goals. The focus will be on delivering value-driven content that resonates with the audience and supports the overall outreach strategy.
We set clear goals for each founder’s content output and track both the content produced and the engagement generated. This ensures that founders remain consistent in building their personal and professional brand.
Content Metrics (Tracked via LinkedIn and Company Website)
We monitor the following content-related metrics on a weekly and monthly basis:
- LinkedIn Content – Number of LinkedIn posts produced by each founder.
- Blog Articles – Number of blog articles published on the company’s official website.
- Projected No. of Reach – Expected number of impressions, views, or reads generated by the content.
- Projected No. of Engagements – Expected number of likes, shares, and comments generated by the content.
- Projected vs. Actuals – The variance between the planned and actual performance in terms of reach and engagement.
- Excess/Short – The surplus or shortfall in content output and engagement compared to targets.
By maintaining consistent content production and tracking performance, we ensure that each founder builds a credible and influential online presence. This helps drive inbound leads, strengthen market positioning, and build long-term brand equity.
5. Sales Metrics

We closely track sales performance for each portfolio company on a weekly and monthly basis. Converting prospects into paying customers is a key indicator of product-market fit and business health, so we monitor sales numbers consistently to measure traction and adjust strategies when needed.
Sales Metrics (Tracked for Each Portfolio Company)
We track the following sales-related metrics to evaluate performance and identify gaps:
- Current Month Projected Customers Sold – The number of customers expected to close in the current month.
- Current Month Actual Customers Sold – The actual number of customers closed in the current month.
- Projected Monthly Customers So Far (YTD) – The cumulative number of customers projected to close for the year to date.
- Actual Monthly Customers So Far (YTD) – The cumulative number of customers actually closed for the year to date.
- Projected vs. Actual Customers – The variance between the planned and actual number of customers.
- Excess/Short Customers – The surplus or shortfall in customer acquisition compared to targets.
6 Customer Success Metrics

Customer success is critical for driving retention and long-term growth. At Pitchworks VC Studio, we track key customer success metrics for each portfolio company to ensure customers are not only onboarded effectively but also receive value from the product or service. This helps improve retention rates and lifetime customer value.
Customer Success Metrics (Tracked for Each Portfolio Company)
- No. of Onboarded Customers – Number of customers successfully onboarded each month.
- Activation Rate – Percentage of customers who complete key activation steps after onboarding.
- Time to Activation – The average time taken for a customer to complete the onboarding process and reach initial product usage.
- Feature Utilization Rate – The percentage of product features actively used by customers.
- Customer Satisfaction (CSAT) – The average customer satisfaction score, typically measured through customer feedback and surveys.
- Time to First Value (TTFV) – The time it takes for a customer to experience the product’s core value after onboarding.
7. Applied Grants and Startup Participation Metrics

We also track the participation of portfolio companies in various external growth programs, including grants, incubators, and accelerator programs. Participation in such programs enhances credibility, unlocks funding, and provides access to mentorship and networking opportunities.
Applied Grants and Participation Metrics (Tracked for Each Portfolio Company)
- No. of Applied Grants – Number of grants applied for by the startup.
- Applied Startup Incubation – Number of startup incubation programs applied for and accepted into.
- Events and Demos Planned – Number of industry events and product demos planned and executed.
- Applied Startup Accelerators – Number of accelerator programs applied for and accepted into.
Goal Setting and Tracking
By monitoring customer success and external participation metrics, we ensure that portfolio companies are not only gaining traction but also building long-term competitive advantages through customer engagement and strategic partnerships.
Implementing Qfloo has significantly improved how we track and manage key North Star metrics across our portfolio at Pitchworks VC Studio. With Qfloo, we have a centralized dashboard that gives real-time visibility into spending, development progress, outreach efforts, sales performance, customer success, and strategic initiatives.
By consolidating data from platforms like Google Sheets, Zoho Books, GitHub, Apollo.io, and LinkedIn, Kwapio into Qfloo, we can quickly identify gaps between projected and actual performance, adjust strategies, and ensure accountability at every level. This has allowed us to make faster, data-driven decisions, improve operational efficiency, and align every department’s efforts with the startup’s core growth objectives. Qfloo has become a critical tool in helping our portfolio companies reach product-market fit faster and scale efficiently.